Contact Info
347 Schaeffer Hall
319-335-2348
timothy-hagle@uiowa.edu
Twitter: @ProfHagle
Fall 2024 Office Hours
Tue & Th: 4:45-6:15
Mailing Address
Dept of Political Science
341 Schaeffer Hall
20 E. Washington Street
The University of Iowa
Iowa City, Iowa 52242
News
Posted updated Prelaw FAQ for UI students
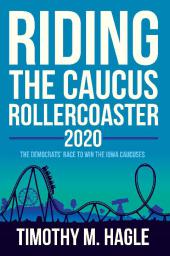
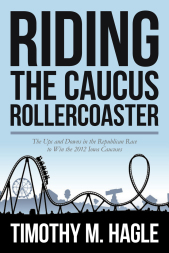
New Book, Riding the Caucus Rollercoaster 2024, published in paperback and for Kindle devices.
Posted updates to 12 papers in Iowa Voting Series for 2022 election data
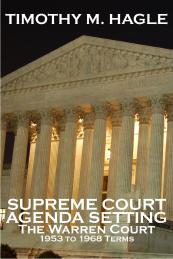
New Book, Supreme Court Agenda Setting: The Warren Court, published for Kindle devices and computers with Kindle reader.
Published updated and expanded edition of Prelaw Advisor in paperback and for Kindle readers
My books
Iowa Voting Series
I have started this page to make available a series of short papers examining voter registration and turnout statistics in Iowa. Several of the papers will rely on data from the Iowa Secretary of State's office that are regularly updated. As such, the papers relying on particular data will be updated accordingly. Below the title of each paper is an abstract for that paper. The titles are linked to pdf files for the paper. Comments are welcome, but at least for now must be sent to me via either Twitter (@ProfHagle) or my UI email address (timothy-hagle@uiowa.edu).
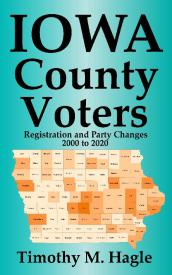
There are currently 12 papers in the series. Below are abstracts for each of the papers followed by a link to download a pdf of the paper. Paper 12 is new (and not included in the second edition of Iowa Votes). It examines party changes among Iowa voters.
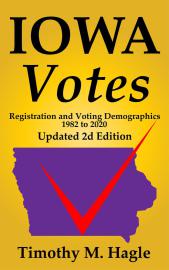
I have now turned the 11 papers in the Iowa Voting Series into a book entitled, Iowa Votes. The book is only available in electronic form on Kindle-capable devices (which includes computers with the free Kindle reader). As with the papers, the many figures are at the end of the book. This second edition contains updates based on the 2018 and 2020 elections. At only $9.99 the price is right!
Here's the description of the book on Amazon.com:
Iowa has long been considered a swing state in general elections. In Iowa Votes, Political Science professor Tim Hagle, author of Riding the Caucus Rollercoaster, helps to explain why this is so by examining Iowa voter registration and election turnout data in terms of three key demographic factors: political party, sex, and age group. The examination of groups and subgroups related to these factors reveals several overall trends as well as the effects of particular elections. In addition to looking at general election turnout Hagle devotes chapters to primaries and absentee voting. The text describes and provides context for the findings, which are presented graphically in over 140 figures. Iowa Votes is an interesting and informative look at voting in an important swing state.
Paper 1: An Empirical Examination of Iowa Voter Registration Statistics Since 2000 (February 2023 update)
This is the first paper in a series examining aspects of voting in Iowa. In this short paper I take a look at Iowa’s voter registration statistics since January 2000. One goal of the paper is to help explain why Iowa is considered a swing state. Data for the examination come from the Iowa Secretary of State website which posts monthly updates on voter registration in the state. Results show that the number of registered voters in Iowa has remained fairly stable since 2000, much like its population. Registration between Democrats and Republicans has also remained quite stable and fairly equal during the period with four exceptions: a lead opened up by Republicans in 2002-2003, a larger lead opened up by Democrats in 2008-2009, a lead by Republicans in 2017-2018, and a lead opened up by Republicans in 2020. In the first three instances the gap closed and the two parties returned to near equality. No Party voters (what Iowa calls registered voters who do not register with either political party) were always more numerous than those for either party until a huge party shift for the June 2020 primary.
01VoterRegistrationStats202302.pdf
Adobe Acrobat document [485.8 KB]
Paper 2: An Examination of Iowa Turnout Statistics Since 1982 (February 2023 update)
This is the second paper in a series examining aspects of voting in Iowa. In this paper I examine Iowa’s turnout in presidential and midterm elections since 1982. Turnout for voters registered as Democrats or Republicans was quite good, but turnout for No Party voters (Iowa’s name for independents) was much lower. Republican turnout in the period examined was always higher than that of Democrats, but with only a few exceptions the two tracked fairly closely. Consistent with conventional wisdom and other examinations turnout was much lower in midterm election years. The average drop for Democrats during the period examined was 15.77%, for Republicans it was 12.78%, but was 23.25% for No Party voters. Despite the lower turnout of No Party voters they tended to determine the outcome of Iowa elections because of the near parity of voters in the two major parties.
02StateTurnoutExtended2023.pdf
Adobe Acrobat document [235.6 KB]
Paper 3: An Examination of Iowa Turnout Statistics Since 1982 by Party and Sex (February 2023 update)
This is the third paper in a series examining aspects of voting in Iowa. In this paper I examine Iowa’s turnout in presidential and midterm elections since 1982 with a focus on party and sex. Looking first at registration numbers I find that women led men in voter registrations by an average of 103,502 during the period. Within political parties (Democrats, Republicans, and No Party voters) there were distinct differences in registration. Republicans had the most even division with women leading at the beginning of the period and then men overtaking them and opening a lead of 47,587 by 2022. Women led No Party voters throughout the period by a fairly consistent margin averaging just under 27,000 voters. This difference was most reflective of the overall registration difference for all Iowa voters on a percentage basis. Women also led men in registered Democrats. The gap for Democrats was large at the start of the period at 40,030 voters and widened to 123,062 by the end of the period. In terms of turnout, the differences between men and women were relatively small. Republican women had the highest turnout percentage for 20 of the 21 general elections during the period. Republican men came in second in all but 1982 (where they led), 1988, and 2008. Women Democrats had a higher turnout percentage than their party’s men in presidential elections, but the men had a slightly higher percentage in seven of the 11 midterm elections. No Party voters, men and women, had much lower turnout percentages in both presidential and midterm elections than either Democrats or Republicans. No Party women had a higher turnout percentage in all 10 presidential elections while men took the lead in all 11 midterm elections. The large number of No Party voters who joined a party for the June 2020 primary dramatically affected voter registration statistics but less so turnout percentages.
03IATurnoutDemoGenderExtended2023.pdf
Adobe Acrobat document [219.0 KB]
Paper 4: An Examination of Iowa Turnout Statistics Since 1982 by Party and Age Group (May 2023 update)
This is the fourth paper in a series examining aspects of voting in Iowa. In this paper I examine Iowa’s turnout in presidential and midterm elections since 1982 with a focus on party and age group. Iowa’s election statistics are reported for five age groups: 18-24, 25-34, 35-49, 50-64, and 65 & Over. The difference in the age ranges covered by the groups makes direct comparisons difficult, but changes during the period examined are evident as those registered to vote move from one age group to the next. The mix of registered Democrats and Republicans remains relatively stable across age groups during the period. Most striking in terms of voter registration is how No Party registrants go from roughly 50% of those in the youngest age group to only about 20% of those in the oldest group. Looking at election turnout, the data show that there is a clear progression in improved turnout as voters age. In addition, older voters are more reliable, meaning differences in turnout between midterm and presidential elections are less pronounced for older age groups. Turnout differences between Democrats and Republicans are generally small across all age groups, with Republicans nearly always having a slight advantage. Although the turnout percentage of No Party registrants also improves with age, they are always well below Democrats and Republicans.
04IATurnoutDemoAgeExtended2023.pdf
Adobe Acrobat document [297.1 KB]
Paper 5: An Examination of Iowa Turnout Statistics Since 1982 by Sex, Age Group, and Party (May 2023 update)
This is the fifth paper in a series examining aspects of voting in Iowa. In this paper I examine Iowa’s turnout in presidential and midterm elections since 1982 with a focus on sex, age group, and party. Results show that the percentage of registered voters who are women is quite similar among four of the five age groups at just above 50%. The percentage jumps to over 55% for the oldest age group. There are clear differences between the parties for each age group. Democrats generally had the highest percentage of women, Republicans the lowest, and No Party registrants between the two. The differences were greatest in the two youngest age groups and were more compressed in the next two. In the oldest group the percentage was nearly the same for Republicans and No Party registrants, while Democrats were still the highest. In terms of turnout, a general pattern of women having a higher turnout percentage in presidential elections and men a higher percentage in midterm elections was fairly common across parties and age groups. The turnout percentages for both men and women increased for each age group except the oldest. Republican men and women tended to have the highest turnout percentages regardless of age group, but were closely followed by men and women Democrats. Consistent with prior papers in the series, the turnout percentages for men and women No Party voters were clearly below that of voters of either major party.
05IATurnoutAgeSexExtended2023.pdf
Adobe Acrobat document [232.7 KB]
Paper 6: An Examination of Iowa Absentee Voting Since 1988 (May 2023 update)
This is the sixth paper in a series examining aspects of voting in Iowa. In this paper I examine Iowa’s absentee voting in presidential and midterm elections since 1988. The results show a trend for increased absentee voting in Iowa. The trend exists for both midterm and presidential elections, though the average percentage of absentee voting in midterm elections was below the average for presidential elections. In looking at various subgroups based on party, sex, and age group we see that Democrats were more likely to vote absentee than Republicans and women more so than men. Although there were some variations among the subgroups these general trends are fairly robust. The results for age groups were mixed in that the emphasis on both young voters (the 18-24 group) and older voters (the 65 & Over group) resulted in these two groups having the highest average percentages of absentee voting during the period. Nevertheless, because the turnout percentage of the 18-24 group was generally low, the proportion of this group among all absentee voters was still low. The results also showed the effect of GOTV efforts on the part of the parties and campaigns. The greater emphasis on absentee voting in presidential years was evident in the greater percentage of such votes compared to midterm elections.
06IAAbsenteeExtended2023.pdf
Adobe Acrobat document [338.1 KB]
Paper 7: An Examination of Iowa Voter Distribution in Elections Since 1982 (May 2023 update)
This is the seventh paper in a series examining aspects of voting in Iowa. In the second through fifth papers in this series I examined Iowa’s turnout statistics in midterm and presidential elections since 1982 in various combinations of party, sex, and age group. For the most part, these papers only examined the turnout percentages within each group or subgroup. In the sixth paper I changed focus and examined turnout in terms of absentee and early voting. In doing so I looked at the data in terms of turnout percentages for the subgroups, but also in terms of the distributions of subgroups among the voters for a particular election. Looking at voter distributions provided additional information regarding absentee voting, so in this paper I am returning to the prior analyses for an examination of the group and subgroup distributions. The results show that Republicans had a larger proportion of the voters in 14 of the 21 elections examined. Women were consistently more numerous in all 21 elections. Among the five indicated age groups, the 18-24 and 25-34 groups had the smallest proportions. For the three older groups (35-49,-50-64, and 65 & Over) the pattern was more complex, but driven largely by underlying changes in voter registration numbers. Results for combinations of sex, age group, and party are also examined.
07IATurnoutDistributionExtended2023.pdf
Adobe Acrobat document [256.5 KB]
Paper 8: An Examination of Iowa "No Party" Voter Distribution in General Elections Since 1982 (May 2023 update)
This is the eighth paper in a series examining aspects of voting in Iowa. In prior papers I examined various aspects of Iowa’s political party registration, turnout statistics, and voter distribution in midterm and presidential elections since 1982 in various combinations of party, sex, and age group. In this paper I take a closer look at the distribution of No Party votes in the 21 general elections from 1982 through 2022 and attempt to estimate their distribution between the candidates for particular contests. More specifically, I will examine the results of the 10 presidential (1984, 1988, 1992, 1996, 2000, 2004, 2008, 2012, and 2016) and 11 gubernatorial (1982, 1986, 1990, 1994, 1998, 2002, 2006, 2010, 2014, 2018, 2022) elections. After examining the data for those 21 contests I will turn to the 14 elections for United States Senator that occurred in Iowa during the period. The results show that the estimated distribution of No Party votes is more evenly divided in presidential elections, which is also when turnout for No Party voters is much higher. Of the 21 presidential and gubernatorial elections, two of the gubernatorial elections, 1998 and 2002, produced the largest estimated distributions for Democrats. Similarly, six of the eight elections in which the Republican candidate received the majority of the estimated No Party vote were gubernatorial elections. In six of the gubernatorial elections and four of those for president the party of the candidate who won actually turned out fewer party votes, but the distribution of No Party votes overcame the difference. Of the elections for US Senate seats, a combination of incumbency and weak opposition candidates seemed to be important factors for the No Party vote distribution.
08IANoPartyResultsExtended2023.pdf
Adobe Acrobat document [358.8 KB]
Paper 9: An Examination of Iowa Voter Turnout in Primary Elections Since 2000 (May 2023 update)
This is the ninth paper in a series examining aspects of voting in Iowa. In this paper I
focus on the primaries ahead of the general elections from 2000 on. The data for
primaries is not as complete as for general elections, so the focus will be on party
turnout (Democrat and Republican) statewide as well as within Congressional Districts. As with the prior papers in this series my focus will be on the statistics involved rather than
theorizing about the reasons for particular distributions. That said, because specific electoral contests likely drive turnout in certain years (statewide or in the Congressional Districts)
I will speculate a bit more in this paper about the reasons for differences in turnout. On the whole, primary turnout in Iowa is not a generally reliable indicator of general election
turnout. This is due in part to the fact that presidential candidates do not appear on presidential year primary ballots because of the Iowa Caucuses. It is no surprise that factors such as
open seats, weak incumbents, or competitive primaries with quality candidates will tend to increase turnout, particularly at the Congressional District level.
09IAPrimaries2023.pdf
Adobe Acrobat document [847.6 KB]
Paper 10: An Examination of Iowa Absentee Ballots Requested/Sent and Returned Since 2010 (May 2021 update)
This is the tenth paper in a series examining aspects of voting in Iowa. In this paper I examine the timing of absentee requests or sent ballots and returns in general and by party. Although the statewide data are available for only seven elections, the data confirm the greater effort placed on early voting in presidential elections. Nevertheless, absentee voting has increased in midterm elections as well. When examining the early vote effort by party we see that Democrats do better at the early voting game, but Republicans are catching up. The fewest absentee requests or sent ballots come from No Party voters, particularly in midterm elections, which is no surprise given their significant turnout drop in midterms. The results also show a persistent gap between the number of requested or sent absentee ballots and the number returned. The size of this gap varies by party with Republicans having the highest return rate followed by Democrats and then No Party voters.
10IAAbsenteeDays2023.pdf
Adobe Acrobat document [295.8 KB]
Paper 11: An Examination of Absentee Voting in Johnson County (May 2023 update)
This is the eleventh paper in a series examining aspects of voting in Iowa. In the sixth and tenth papers in the series I examined aspects of absentee voting in Iowa as a whole. Because of the availability of more specific data, in this paper I focus on absentee voting in Johnson County. Although Johnson County is not representative of Iowa counties in general, its population size, unusual distribution of registered voters, and the fact that it is home to the University of Iowa make it an interesting case. The findings show that voters in Johnson County have been more likely to cast absentee votes than Iowans as a whole. In addition, despite the emphasis on in-person early voting, traditional mailed absentee ballots are still very popular. Some differences emerge between the parties regarding a preference for mailed ballots versus in-person early voting. There are also party differences in the return rate for mailed absentee ballots.
11JoCoEarly2023.pdf
Adobe Acrobat document [235.8 KB]
Paper 12: An Examination of Party Changes Among Iowa Registered Voters Since 2018 (May 2023)
This is the twelfth paper in a series examining aspects of voting in Iowa. In this paper I examine party switching. Under what could be considered normal circumstances there are usually a small number of voters who switch their party registration each week. Certain events can, however, result in large increases (spikes) in the number of voters who switch. Among the main events identified here, three are related to general elections, three to primaries, one to the Iowa Caucuses, and two to the loss then gain of official party status for the Libertarian Party. A smaller bump in party changes may have been related to the fallout from the Capitol riot. Demographically, women are more often party changers than men. Younger voters are also more likely to change parties than older voters. No Party voters are likely to switch to Democrat or Republican to participate in a primary or the Iowa Caucuses, but some of these voters change back to No Party over time.
12IAPartyChanges2023.pdf
Adobe Acrobat document [1.8 MB]
